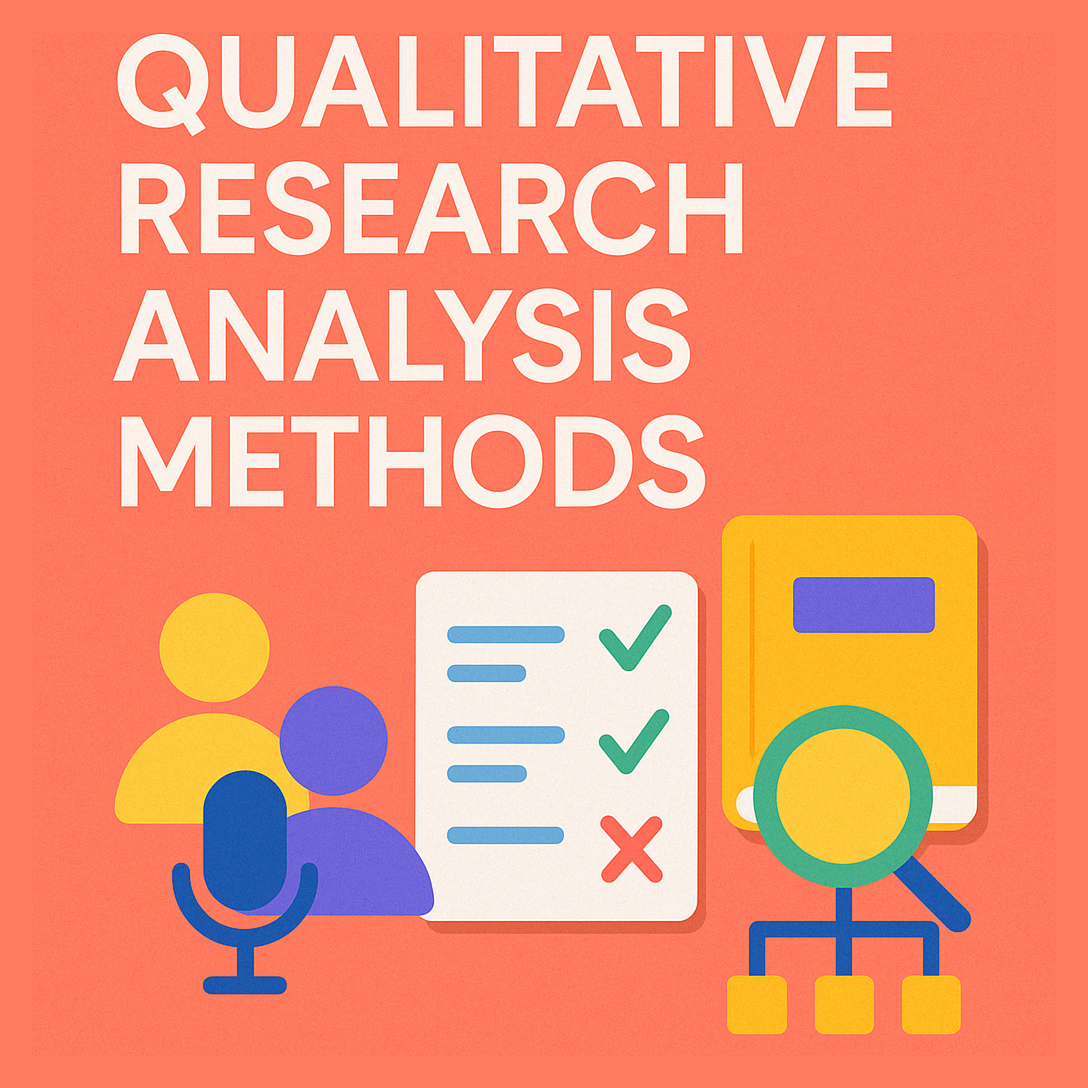

Qualitative research in user experience (UX) and market research – including user interviews, open-ended survey responses, focus groups, and diary studies – yields rich, descriptive data. Extracting meaningful insights from this data can be challenging without a systematic approach. As Nielsen Norman Group notes, identifying themes in data from user studies (e.g. interviews, diary entries, field observations) is often done via rigorous qualitative analysis methods.
Unlike quantitative findings that are easily summarized in percentages or metrics, qualitative observations do not immediately crystalize into obvious conclusions. Researchers can feel overwhelmed by lengthy transcripts or open-ended responses, unsure how to condense numerous stories and statements into actionable findings. To address this challenge, several qualitative analysis methodologies have been developed. Each offers a structured framework for coding and interpreting data, helping researchers uncover patterns or narratives that answer research questions.
Unlike quantitative findings that are easily summarized in percentages or metrics, qualitative observations do not immediately crystalize into obvious conclusions. Researchers can feel overwhelmed by lengthy transcripts or open-ended responses, unsure how to condense numerous stories and statements into actionable findings. To address this challenge, several qualitative analysis methodologies have been developed. Each offers a structured framework for coding and interpreting data, helping researchers uncover patterns or narratives that answer research questions.
This paper provides an in-depth review of five widely used qualitative analysis approaches – thematic analysis, grounded theory, content analysis, narrative analysis, and framework analysis – among others in the field. We compare their goals, procedures, pros and cons, and highlight the contexts in which each method is most appropriate.
For each methodology, we outline critical elements for success (such as coding techniques, recommended tools, and validation strategies) and provide real-world examples illustrating how UX researchers or product teams can apply these methods. By understanding the distinct strengths of each approach, researchers and product managers can select and apply the most suitable qualitative analysis framework for their needs, ensuring rigorous and insightful interpretation of customer and user data.
For each methodology, we outline critical elements for success (such as coding techniques, recommended tools, and validation strategies) and provide real-world examples illustrating how UX researchers or product teams can apply these methods. By understanding the distinct strengths of each approach, researchers and product managers can select and apply the most suitable qualitative analysis framework for their needs, ensuring rigorous and insightful interpretation of customer and user data.
1. Thematic Analysis
Thematic analysis is one of the most commonly used methods for analyzing qualitative data in UX research and other fields. Definition: Thematic analysis is a systematic method of breaking down and organizing rich data from qualitative research by tagging individual observations and quotations with codes, to facilitate the discovery of significant themes.
In simpler terms, the researcher reviews the data (e.g. interview transcripts or survey responses) and labels segments of text with descriptive codes. By examining these codes across the entire dataset, they then identify recurrent patterns of meaning – the "themes" that address the research questions.
Key Characteristics and Process: Thematic analysis is valued for its flexibility and accessibility. It is not tied to a specific theoretical framework and can be applied across various research topics. Braun and Clarke’s influential guidelines (2006) outline a clear six-phase process for conducting thematic analysis. These phases can be summarized as follows:
- Familiarization: Immerse oneself in the raw data by reading transcripts or field notes multiple times, taking initial notes on noteworthy points.
- Coding: Assign initial codes to interesting features of the data systematically across the dataset. Each code labels a concept or observation (for example, "navigation frustration" might be a code in a usability study).
- Searching for Themes: Review the codes and begin grouping related codes into broader themes. A theme is typically a higher-level pattern – for instance, multiple codes like "navigation frustration", "unclear menu labels", and "cannot find features" might all fall under a theme "Navigational Challenges."
- Reviewing Themes: Refine the candidate themes by checking them against the data – ensuring that each theme is coherent and supported by excerpts, and that together the themes meaningfully capture the dataset without significant gaps.
- Defining and Naming Themes: Clearly define what each theme means and decide on an informative name. For example, a theme named "Navigational Challenges" could be defined as "user difficulties in finding content or features due to information architecture issues."
- Reporting: Produce the final analysis by writing up each theme with supporting quotes or examples from participants, explaining how it answers the research objectives.
Throughout this process, the analyst may iterate – going back to recode data or adjust theme definitions as understanding deepens. This iterative coding and reviewing is a critical element to ensure that the themes are truly grounded in the data and not superficial impressions.
When to Use Thematic Analysis: Thematic analysis is highly versatile and is appropriate in many exploratory research scenarios. It is especially useful for understanding common experiences, perceptions, or behaviors across a set of participants. UX teams frequently employ thematic analysis to synthesize findings from user interviews or open-ended survey comments, because it excels at surfacing the key issues or needs voiced by users.
Notably, because of its clear, step-by-step process, thematic analysis is often recommended for novice qualitative researchers as an approachable yet rigorous method. It allows a structured analysis without requiring deep expertise in formal qualitative theory, making it a go-to choice in fast-paced product research environments.
Strengths: Thematic analysis offers several advantages:
-
Flexibility: It can be applied to virtually any qualitative dataset and adapted to both inductive analysis (deriving themes purely from data) or deductive analysis (starting with pre-conceived categories based on theory or prior knowledge).
-
Clarity and Ease of Use: The well-defined phases (familiarize, code, theme development, etc.) provide a clear roadmap. Researchers have reported that Braun & Clarke’s process makes thematic analysis easy to follow and learn.
-
Rich Descriptions: It preserves a lot of context from the data. By using direct quotations to illustrate themes, the analysis can retain the voice of participants, yielding insights that are both compelling and grounded in real user expressions.
-
Pattern Recognition: It helps uncover not only what issues or ideas are common, but also how they interrelate. By examining how codes co-occur, analysts can map relationships between themes (e.g. "Navigational Challenges"might be found alongside another theme "Lack of Onboarding", suggesting a broader pattern of "Learning Curve Issues.")
Limitations: Despite its strengths, thematic analysis has some limitations:
-
Subjectivity: The researcher’s judgment plays a big role in what codes and themes are identified. Different analysts might derive slightly different themes from the same data. This subjectivity means results must be considered with an understanding of the researcher’s possible biases. Clear documentation of coding decisions (an audit trail) and, if possible, involving multiple analysts can mitigate this. Teams often conduct peer debriefs or compare coding to improve reliability.
-
Potential for Superficial Coding: If not done carefully, one might stick to very obvious or surface-level observations and miss deeper insights (for example, focusing only on the most frequently mentioned issues and overlooking subtle but important sentiments). Rushing the analysis can result in simply summarizing what each participant said (a "regurgitation of details") without true synthesis. It takes discipline to move from raw quotes to higher-level interpretation.
-
Volume of Data: Thematic analysis can be time-consuming, especially with large datasets. Reading and coding hundreds of pages of transcripts is labor-intensive. Without good project management, one can get overwhelmed or lose focus of the research objectives. Setting clear goals for the analysis and possibly using software tools (discussed below) to organize data can help manage this complexity.
Tools and Critical Techniques: In modern UX research practice, various tools assist with thematic analysis. Software like Reveal can be used to facilitate coding – allowing researchers to tag excerpts and later retrieve all quotes under a given code quickly. Such tools also help in rearranging codes into themes and keeping track of definitions. Some teams use more informal tools like spreadsheets or even analog methods (e.g. printing quotes on sticky notes and affinity mapping them on a wall) to physically group related ideas – a common workshop-style approach in product teams.
The specific tool is less important than the rigor of the coding process. A critical element is maintaining consistency in how codes are applied; if multiple researchers code data, they should first align on a coding scheme (codebook) and possibly test intercoder agreement on a subset of data to ensure reliability. While formal intercoder reliability statistics are not always calculated in thematic analysis, having two people independently code and then resolve differences can strengthen the credibility of the themes.
Validation techniques for thematic analysis focus on ensuring trustworthiness of the findings. This can include triangulation (checking if themes are corroborated by other data sources or methods), and member checking (sharing a summary of themes or interpretations with research participants to see if they feel it accurately reflects their experiences). For example, after a thematic analysis of user interview data, a UX researcher might present the identified themes (and perhaps illustrative quotes) to a few interviewees or stakeholders to verify that the interpretations "ring true." Employing these practices improves the credibility of the analysis, so that the resulting themes are not just artifacts of one analyst’s perspective but have broader resonance.
Example Application: Thematic analysis is widely applied in product design and user experience studies. For instance, suppose a product team conducts 10 in-depth user interviews about a new mobile app. Through thematic analysis, they might identify themes such as "Navigational Challenges," "Feature Discoverability," "Trust and Security Concerns," and "Delight Factors." Each theme encapsulates several users’ stories and quotes.
One real-world example comes from a product team using thematic coding on customer-feedback survey responses to pinpoint major pain points: researchers discovered themes like "poor navigation" and "buggy interface", which highlighted UX issues to prioritize.
The outcome of the analysis would be a set of well-defined themes, each backed by multiple pieces of evidence, which provide actionable insights – e.g. “Several users find it hard to navigate (Navigational Challenges); simplifying the menu and adding a search feature could address this." These thematic insights help stakeholders understand the qualitative feedback at a glance and drive design decisions grounded in actual user experience patterns.
2. Grounded Theory
Grounded theory (GT) is both a qualitative research methodology and an analysis approach, originally developed in the field of sociology, that aims to generate new theory grounded in the data itself. Rather than starting with a hypothesis or existing framework, grounded theory researchers collect data with an open mind and allow theories or explanations to emerge from that data through a systematic coding process.
Definition: Grounded theory is a systematic qualitative research method that collects empirical data first, and then creates a theory "grounded" in the results.
In essence, the theory is born from the data, rather than data being used to confirm an existing theory. This inductive approach contrasts with deductive research methods and is particularly powerful for exploring areas where little prior knowledge or theory exists.
Key Characteristics and Process: Grounded theory has a distinctive, iterative analysis process. Data collection and analysis occur in tandem, informing each other in what is called the constant comparative method. Here are the critical steps and concepts in grounded theory analysis:
-
Open Coding: After data is collected (often via interviews or observations), researchers begin with open coding – breaking down qualitative data (transcripts, field notes) into discrete pieces and assigning labels to describe what each piece represents. These codes are often very close to the data (sometimes called in vivo codes when using participants’ own words). For example, in studying user behavior in a new app, an open code might be "keeps tapping X with no result" or "expresses frustration about privacy." During open coding, one generates a large list of codes without worrying yet about how they relate.
-
Axial Coding: In this next phase, the researcher examines the open codes to see how they can be grouped into categories or subcategories, and how they relate along dimensions. Axial coding involves re-reading the data and codes, looking for connections, such as causal relationships or hierarchies among concepts. For instance, multiple open codes related to user frustration (tapping with no result, unclear error messages, feature not responding) might be grouped under an axial code (or category) called "Usability Obstacles." The researcher refines categories, noting properties of each (e.g. types of usability issues, conditions when they occur).
-
Selective Coding: As the data collection and analysis progress, certain core categories emerge as central to explaining the phenomenon. In selective coding, the researcher focuses on these central categories and systematically relates other categories to them, formulating a tentative theoretical model. At this stage, one might identify a single storyline or key finding that integrates the categories. For example, a grounded theory might coalesce around the idea that "Users’ trust in the app is built or broken through cumulative micro-interactions", with categories like Usability Obstacles, Transparency, and Positive Reinforcement all feeding into the user’s evolving trust. The final result is often a statement of theory – a set of propositions explaining how and why certain patterns occur in the data.
-
Theoretical Sampling and Saturation: A hallmark of grounded theory is that data collection is responsive to the analysis. Researchers often employ theoretical sampling, meaning they decide what data to collect next based on the emerging theory. If early coding suggests a certain category is important, the researcher might conduct follow-up interviews focusing on that aspect to elaborate or challenge the developing theory. This cycle continues until theoretical saturation is reached – the point at which new data no longer yields new insights for the core categories. Saturation signals that the theory is well-developed and further data would just repeat what is already known.
Throughout these stages, researchers write memos – analytic notes that record thoughts about codes, category meanings, and theory ideas. Memos form an important part of the audit trail and help in conceptualizing the connections in the data. The end product of grounded theory is typically a set of interrelated concepts that explain the behavior or process under study, often framed as a new theoretical model or set of hypotheses.
When to Use Grounded Theory: Grounded theory is most appropriate when the goal is to develop a new theory or explanatory model for a phenomenon, especially in areas that are not well understood. In a business or UX context, teams might choose grounded theory when exploring a complex process or user journey with no preconceived expectations. For example, if a company is investigating why a novel technology product isn’t being adopted and there’s little prior research on that user domain, a grounded theory approach could help reveal underlying reasons and mechanisms from the ground up.
Grounded theory is also useful if the research question is oriented toward understanding process, social interactions, or motivations in depth – essentially asking "what is happening here and how can we explain it?" It has been noted that businesses find GT valuable when looking into topics with either no existing theory or a need for a fresh perspective. Unlike simpler thematic summaries, grounded theory yields a cohesive explanation that can inform strategic decisions, such as identifying key factors that influence user behavior.
Strengths:
-
Theory Generation: The primary strength of grounded theory is its ability to generate novel insights and theoretical frameworks. Rather than just describing data, it produces an explanatory theory that is directly grounded in empirical observations. This makes the findings particularly persuasive, as they are built on systematic evidence.
-
Exploratory Power: Because it does not require a hypothesis at the outset, GT is excellent for exploratory research. It encourages openness – researchers begin with broad questions and allow unexpected themes to emerge, reducing the chance that important phenomena are overlooked due to preconceptions.
-
Structured, Yet Flexible: Grounded theory provides a clear set of procedures (open/axial/selective coding, constant comparison) to follow, which lends rigor to the analysis. At the same time, it is flexible in data collection – researchers can pivot and explore new directions as theory emerges (theoretical sampling). This adaptability often leads to a very thorough understanding of the topic.
-
Validating Through Constant Comparison: The method inherently builds in validation by continuously comparing new data to the emerging theory. Any contradictions must be resolved by modifying the theory or acknowledging limits, which strengthens the final result’s credibility. Essentially, as categories are refined and tested against incoming data, the analysis self-corrects and bolsters the validity of the conclusions.
Limitations:
-
Time and Resource Intensive: Conducting a true grounded theory study is laborious. It typically requires multiple rounds of data collection and analysis. Researchers must transcribe interviews, perform detailed coding, write memos, recruit additional participants to probe emerging questions, and so on, until saturation. In a fast-moving product development context, this comprehensive process may be difficult to execute fully due to time constraints.
-
Complexity: The multi-layered coding process (open→axial→selective) can be complex to manage, especially for those new to the method. It demands a high level of analytical skill to know when to collapse codes into categories or how to theorize relationships. Misapplication of grounded theory (e.g. prematurely fixing on a theory without sufficient comparison, or not iterating on data collection) can lead to weak or biased theories. Training and sometimes mentorship are beneficial when using GT for the first time.
-
Volume of Data: Similar to thematic analysis, grounded theory can generate an overwhelming amount of codes and memos. Without careful organization, researchers might drown in data or lose track of the evolving theory. Software tools (like Reveal ) are often used to manage the coding process for GT, given the need to constantly sort and compare excerpts.
-
Generalizability: The theories produced are specific to the context of the study. If not supplemented with further testing, a grounded theory remains a hypothesized model. In product research, teams might derive a theory about user behavior from qualitative data, but they may then need to validate it (perhaps via quantitative studies or in different user populations) to ensure it applies broadly. In other words, GT provides depth and conceptual understanding, but additional work is often needed to generalize findings.
Critical Elements for Success: Successful grounded theory analysis requires rigor in coding and constant reflexivity. Researchers must be willing to question their assumptions continually – since GT posits no initial hypothesis, it’s crucial to let the data lead. Maintaining a detailed audit trail (records of codes, category definitions, decision points, and memos about theory development) is important so that others can trace how the theory was built from the data.
Engaging in peer debriefing (discussing emerging theories with colleagues or mentors) can also help catch biases or leaps in logic. Some teams employ intercoder comparisons at the open-coding stage: for example, two researchers might independently code a couple of transcripts and then compare code lists to ensure important concepts aren’t missed and that coding is consistent.
However, given that GT is often done by a single researcher or a tight-knit team, member checking can also be valuable here – returning to participants with the tentative theory or model to see if it resonates with their experience (a form of validation that adds credibility to the theoretical framework).
Example Application: Grounded theory is less commonly used in quick UX projects, but it shines in exploratory, strategic research. For instance, a market research team might use grounded theory to investigate why users of a new wearable device stop using it after a few weeks. They conduct open-ended interviews and observations with users over time. Through open and axial coding, they uncover categories such as "Initial Excitement," "Usage Habit Formation," "Perceived Benefits," and "Barriers to Continuation."
As they interview more users (theoretical sampling focusing on, say, users who quit early versus those who persisted), a theory emerges: continued use is driven by whether users integrate the device into a daily routine within the first two weeks (habit formation), which in turn depends on clear immediate benefits and the mitigation of any friction (such as discomfort or complex setup). This grounded theory provides a causal explanation of user disengagement.
A real-world business example is using grounded theory to analyze customer survey responses to explain high churn rates: product marketing teams have used GT to develop hypotheses about why users leave a service and what could make them stay. In another scenario, an HR department might apply grounded theory to exit interview data to generate a theory of why employees leave the company – for example, revealing a core theme around lack of growth opportunities connected with subthemes like mentorship absence and stagnant roles.
These theories directly inform strategic interventions (product improvements, retention strategies) and are grounded in qualitative evidence rather than guesswork.
3. Content Analysis
Content analysis is a method that bridges qualitative and quantitative analysis, involving systematically categorizing textual (or visual) data to identify patterns, frequencies, and meanings. Traditional content analysis originated in communications research, where researchers might count occurrences of certain words or topics in newspapers, for example. In the context of UX and market research, content analysis is often used to sift through large volumes of open-ended responses or user-generated text to quantify themes or sentiments.
One definition is: Content analysis is a qualitative research method that examines and quantifies the presence of certain words, subjects, and concepts in textual or media data. By transforming qualitative input into quantitative counts or categories, content analysis helps researchers draw objective conclusions about what is being emphasized or discussed in the data.
Key Characteristics and Process: Content analysis can be conducted in two main ways – inductively (allowing categories to emerge from the data) or deductively (using a predefined set of categories or keywords to code the data). In practice, many analyses use a combination of both. The general process for content analysis involves:
-
Defining the Unit of Analysis: First, decide what units will be counted or categorized. This could be individual words, phrases, sentences, or whole answers. For survey responses, a common unit is a respondent’s answer to a single open-ended question. In interview transcripts, one might break text into meaning units (sentences or paragraphs addressing one idea).
-
Developing a Coding Scheme: If using a deductive approach, the researcher starts with a list of categories or codes of interest (e.g., categories of feedback like "Performance," "Usability," "Feature Request," "Praise," "Complaint" for app review comments). In inductive content analysis, one would read through a subset of data and allow categories to emerge, then refine and finalize a coding scheme.
-
Coding the Data: Go through the textual data and assign each unit to one or more categories according to the coding scheme. For example, if analyzing 500 open-ended survey comments about a product, each comment would be read and tagged as fitting one or multiple categories. This could be done manually by researchers or with the help of text-analytics software.
-
Quantifying and Analyzing Patterns: Once all data is coded, the frequency of each category is calculated. The result might be that out of 500 comments, 120 (24%) mentioned "Usability issues," 80 (16%) mentioned "Missing features," 50 (10%) were "Positive feedback/praise," etc. These counts can be used to identify the most common concerns or topics. Additionally, content analysis might involve looking at co-occurrence of categories (e.g., how often does “Usability issue” appear in the same comment as “Support Request”?).
-
Interpretation: The researcher interprets the results, often by relating frequencies to research questions. For instance, if a content analysis of feedback indicates “Customer Support” issues are mentioned by 30% of respondents, a market researcher would highlight that as a significant area to address. Interpretation also includes exemplifying each category with quotes or examples from the data to give context to the numbers – blending the quantitative summary with qualitative illustration.
Content analysis may be further distinguished as manifest vs. latent analysis. Manifest content analysis deals with the visible, surface content (e.g., counting specific words or explicit statements). Latent content analysis goes deeper to interpret the underlying meaning (e.g., categorizing an interview statement into “expresses trust” vs “expresses fear,”which requires some inference).
The latter is more qualitative and closer to thematic analysis in spirit, while the former is more purely quantitative. Many real-world analyses incorporate both – for example, coding for whether a comment sentiment is positive/neutral/negative (latent, interpretive) and also counting specific features mentioned (manifest).
When to Use Content Analysis: Content analysis is especially useful when you need to handle large volumes of qualitative text systematically and produce an overview of key topics or sentiments. It’s commonly applied in survey research – for instance, if you have thousands of responses to an open-ended question like “What do you dislike about this product?”, content analysis provides a way to summarize that data into a manageable set of categories with frequencies. Market researchers and customer service teams often use content analysis to monitor feedback trends or brand perception.
In UX, content analysis can be used to analyze things like app store reviews, social media comments, or support chat transcripts, where one wants to quantify what issues or themes are most prevalent. Because it quantifies data, content analysis allows integration with other metrics – for example, you might find that “login problems” are 15% of complaints this month, up from 5% last month, indicating a new issue with a recent update.
It is also appropriate when you have predefined aspects you want to evaluate in text. If a product manager is interested in three specific areas (say “usability,” “performance,” and “pricing”) and wants to know how often each comes up in user comments, a directed content analysis can focus on those categories.
Strengths:
-
Handles Large Datasets: Content analysis is well-suited for very large sets of qualitative data that would be hard to digest purely by reading. By categorizing and counting, it summarizes data efficiently. This makes it possible to process thousands of data points (e.g., reviews, survey responses) in a way that thematic analysis (which requires deep reading of each) might not easily scale to.
-
Quantitative Rigor: Because it yields numerical outputs (counts, percentages), content analysis allows more objective comparison and statistical analysis. This can lend weight when presenting to stakeholders who respond to numbers. For example, a report might say “30% of users mentioned difficulty with onboarding” which is straightforward and impactful. These quantitative results can be tracked over time or compared across segments (e.g., comparing feedback categories between new users vs. power users).
-
Clear and Structured: The process, especially when categories are defined in advance, can be straightforward and replicable. If the coding scheme is well-defined (with clear inclusion/exclusion criteria for each category), different analysts should be able to apply it with high consistency. In fact, inter-coder reliability can be measured in content analysis by having multiple coders categorize a sample and computing agreement statistics. This is a common practice to ensure the coding scheme is unambiguous and the analysis is reliable.
-
Versatility of Data Types: While often applied to text, content analysis can also be used for other media – e.g., systematically coding images (what objects or people appear), videos, or audio transcripts. In user research, one might code user-generated photos or screenshots in a diary study (for example, tallying what types of activities users photographed). The method is adaptable as long as content can be categorized.
Limitations:
-
Loss of Context: By reducing rich qualitative data to categories and counts, content analysis can strip away nuance. Two users might mention “navigation” – one because they got lost (negative), another because they found it easy (positive) – but a simple category count of “navigation” mentions would not differentiate these sentiments. Without careful attention, the meaning behind words may be oversimplified. Qualitative context (the how and why) can be lost if one only focuses on frequencies.
-
Category Bias: If using a deductive coding frame (predefined categories), the analysis is limited to those categories and might ignore important themes that don’t fit. Conversely, if doing inductive coding, the initial coders’ interpretations shape what categories emerge. In both cases, biases in how categories are defined can skew results. For example, an analyst might inadvertently formulate categories that align with their expectations and thus fail to notice comments that indicate a completely unexpected concern.
-
Counting Issues vs. Importance: Frequency does not always equate to importance. A problem mentioned by only 2 out of 100 users might be critical (if those 2 experienced catastrophic failures), while a minor annoyance might be mentioned by 15 users. Pure frequency counting could mislead prioritization. Content analysis needs to be complemented with qualitative judgment – sometimes rare but severe issues deserve attention beyond their count.
-
Requires Consistent Coding: Achieving high reliability in coding can be challenging if responses are complex. Some responses might fit multiple categories or none well. Coders must be trained to apply rules consistently, otherwise the quantification becomes unreliable. This often requires creating a detailed codebook and conducting pilot coding to refine definitions. The process of reaching good intercoder agreement can be time-consuming, somewhat offsetting the efficiency gains in analysis.
Tools and Techniques: To conduct content analysis at scale, researchers frequently leverage software. Text analytics tools like Lexalytics, Clarabridge, or Thematic (and even general QDA software like Reveal ) can assist in automating parts of the process, such as keyword extraction or sentiment analysis. Some tools use natural language processing (NLP) to cluster similar responses or detect emotions in text.
For example, an AI-based tool might automatically group survey comments by topic or flag whether each comment is positive or negative. These can drastically speed up analysis, though a human should always validate automated categorizations for accuracy. Even simple programming or spreadsheet functions can help count word frequencies or filter responses by keywords. Visualization of content analysis results is often done via charts (bar charts of category frequencies, word clouds for common terms, etc.), which can be included in reports to illustrate the findings.
Validation: Given its quantitative nature, validation in content analysis often involves reliability checks. High inter-coder reliability (if multiple analysts) indicates the categories are clearly defined and data is interpreted consistently. Additionally, one might use triangulation by comparing content analysis results with other data.
For instance, if 20% of user comments mention “slow performance,” one might triangulate by looking at customer support tickets or analytics data to see if there are corresponding signals (like increased load times).
Another validation step is member checking in a limited sense – because content analysis usually deals with many anonymous responses, one can’t practically confirm each interpretation with the original author. However, if the content analysis is part of a larger study, researchers might discuss findings with a user advisory group or internal stakeholders who have direct user contact to see if the categories resonate as plausible and comprehensive. Ensuring face validity – that the categories make intuitive sense to others – is important.
Example Application: Content analysis is very prevalent in customer feedback analysis. Consider a scenario: A SaaS product team launches a feedback survey to all users who recently cancelled their subscription, asking “Why did you decide to cancel?” They receive 1,000 open-ended responses. Through content analysis, they classify the reasons. Suppose the results are: 30% cite price too high, 25% cite missing features, 20% mention bugs or reliability issues, 15% found a better alternative, and 10% other. This quantitative breakdown (often displayed as a bar chart) directly informs where the product or business might need to improve.
Such analysis could be done manually by reading responses and tallying categories, or accelerated with a text analysis tool. As a concrete example, researchers have used content analysis on social media data – e.g., analyzing brand mentions on Twitter – to measure brand sentiment and reputation.
Another example: a UX research team might analyze hundreds of app store reviews for their mobile app, coding each review for the primary topic. They might discover that the most frequent review theme is “crashes/freezes”, followed by “feature requests” for a specific feature, and “UI design feedback.” This guides the team to focus on stability in the next update.
Content analysis was described by one practitioner as instrumental in understanding which blog topics performed best to drive user sign-ups, by analyzing and categorizing blog content and its outcomes. These cases show how content analysis translates qualitative text into strategic insights through categorization and counting.
4. Narrative Analysis
Narrative analysis is a qualitative approach focused on the stories that people tell – how they make sense of events and experiences by structuring them as narratives. Unlike thematic or content analysis, which break data into parts (codes, categories) often mixing many participants’ responses, narrative analysis seeks to preserve the integrity of individual stories and examine their form and content as wholes. In UX and customer research, narrative analysis is particularly relevant for diary studies, longitudinal interviews, or any method where participants share detailed personal accounts of their experiences over time.
Definition: Narrative analysis is an approach used to interpret research participants’ stories (e.g. personal testimonials, case histories, or sequential diary entries) to understand how people construct meaning from their experiences. It involves a dual interpretation: first, the participant interprets their own experiences by telling a story, and then the researcher interprets that story to glean insights.
Key Characteristics and Process: There is no single, standardized procedure for narrative analysis, as it can take different forms depending on the researcher’s focus (some might analyze content of stories, others the structure, others the context). However, several common elements and strategies can be outlined:
-
Treating Each Narrative as a Unit: In narrative analysis, a “narrative” could be an entire interview or a segment where a participant recounts a specific incident (“a story about one time something happened”). Researchers first identify narratives within their data. For example, in an interview, a participant might share a story of how they started using a product and what happened over a month – that could be treated as one narrative unit. Importantly, narrative analysts often do not disassemble the narrative into many discrete codes as thematic analysis would; instead, they might annotate larger chunks corresponding to the story’s sections (beginning, middle, end) or key plot points. The goal is to keep the story intact to understand it in context.
-
Analyzing Structure and Content: One approach to narrative analysis is examining how the story is told. This involves looking at narrative structure elements. For instance, William Labov’s model of narrative structure identifies parts like Abstract (summary of the story), Orientation (setting the scene – who, when, where), Complicating action (the events or turning point), Evaluation (the storyteller’s reflection on meaning), Resolution(how it ended), and Coda (closing, bringing the listener back to present). A researcher may code a transcript according to these structural elements to see how participants organize their experiences. Are there common patterns in how different users’ stories unfold? For example, multiple users might have a narrative where the complicating action is a critical incident of product failure, followed by a resolution where they either found a workaround or gave up. Recognizing these narrative patterns can highlight crucial moments in user journeys (like the points that make or break the experience).
-
Analyzing Themes and Meaning in Narratives: Another angle is to focus on the content and meaning of the story as a whole. What is the point of the story for the teller? A narrative analysis might interpret the moral or lesson that a user’s story conveys about the product or service. For instance, a user’s detailed story about how a fitness app helped them train for a marathon may carry themes of empowerment, behavior change, and community support. The analyst might note how the participant portrays themselves (hero of their story? victim of circumstances? collaborator with the app?). These interpretations can yield insights into how a product fits into users’ lives and identities.
-
Preserving Chronology and Causality: Narratives are inherently chronological (even if people sometimes tell them non-linearly). Narrative analysis pays attention to sequence: what events led to what outcomes over time. This is useful in diary studies or longitudinal research. For example, analyzing a user’s week-long diary entries narratively might reveal that early positive experiences were later undermined by a bad encounter, or vice versa. Understanding the chain of events and their causal links in a narrative form can inform, say, which stage of a user journey needs intervention.
-
Comparing Narratives: After analyzing individual narratives, researchers may compare and contrast them. Unlike thematic analysis which merges data, narrative analysis might compare stories in terms of types or genres. One might find, for example, two dominant narrative “arcs” among users: one is a redemption narrative (initial struggles with a product that eventually lead to success and satisfaction), and another is a frustration narrative (initial excitement that turns into disappointment). By identifying such narrative types, product teams can understand diverse user experiences on a more holistic level than a set of fragmented themes.
When to Use Narrative Analysis: Narrative analysis is most applicable when your data is rich in story form – when participants have provided detailed accounts that include context, events, and reflections. It’s particularly useful for diary studies, life histories, or longitudinal interviews. UX researchers use diary studies to capture how experiences unfold naturally; narrative analysis of diary entries can highlight the evolving relationship between user and product over time. It’s also valuable when you care about individual differences and the meaning of experiences to people, not just aggregate patterns.
In market research, narrative analysis might be used in customer journey research – for example, understanding the customer’s journey of discovering, using, and possibly quitting a service through the stories they tell about those experiences. If the goal is to craft personas or customer profiles, narrative analysis helps in forming coherent stories that define those personas (e.g., “This is Alice’s story: she is a busy mother who adopted our app and this is how it fit into her daily routine…”). In essence, use narrative analysis when the narrative itself – the plot, characters (like the user, the product, others), and the setting – can provide insights that a decontextualized list of themes might miss. It shines in uncovering the human perspective and context behind user actions.
Strengths:
-
Depth of Understanding: By examining complete stories, narrative analysis can provide a deep, holistic understanding of an individual’s experience. It maintains the complexity of human experience rather than slicing it into abstracted codes. This can reveal insights about why something happened, capturing the interplay of factors over time.
-
Preserves Context and Sequence: Narrative analysis inherently preserves the context (social, temporal, etc.). We learn not just what issues a user faced, but in what situation and sequence they faced them. For example, a narrative might show that a user’s trust in a product was initially high but after a sequence of problems, it deteriorated – a temporal pattern critical for designing interventions (like improved onboarding or support at key moments).
-
Elicits Empathy and Connection: Stories are a natural way humans communicate, so findings presented as narratives can be very compelling to stakeholders. Sharing a well-analyzed user story in a report can often be more memorable than presenting statistics. It helps product team members and managers empathize with the user’s journey. Narrative analysis can thus be powerful for advocacy – ensuring the “voice of the customer” is heard in a way that resonates.
-
Uncovers Implicit Meanings: Through narrative, researchers can detect underlying values, emotions, and identity-related themes. For instance, how a user frames their story might show whether they see a technology as empowering or threatening. These kinds of insights (the role a product plays in someone’s life story) are valuable for branding, marketing, and design strategy, as they speak to the product’s emotional or symbolic significance.
-
Flexible Data Sources: Narrative analysis isn’t limited to spoken or written narratives; it can also apply to visual storytelling or any medium where a narrative is present. For example, analyzing a series of user-generated videos about their daily routine with a product could be done narratively, understanding each video as a chapter in the user’s story.
Limitations:
-
Not Generalizable or Scalable: Because it often focuses on individual cases, narrative analysis does not readily produce broad generalizations. Each narrative might be unique. While one can identify common narrative patterns, the strength of evidence is usually illustrative rather than quantitative. This could be seen as a drawback when stakeholders ask “how often does this happen?” – narrative analysis won’t answer frequency questions well (that would need content or thematic analysis). It also can be impractical to do in studies with dozens of participants, as producing and comparing many narratives in depth is time-consuming.
-
Data Requirements: Narrative analysis needs good story data. If interviews are very structured with short answers, or survey responses are one-sentence long, there may not be much of a narrative to analyze. This method works best when participants naturally produce rich narratives, which depends on study design (questions that invite storytelling) and participants’ willingness and ability to share stories. In some UX contexts, users may not spontaneously narrate experiences unless prompted, so the researcher must be skilled in eliciting narrative (through open-ended questions like “Tell me about the last time you…”) during data collection.
-
Subjective Interpretation: Interpreting narratives can be quite subjective. Two researchers might derive different meanings from the same story. For example, a user’s story about abandoning a software could be interpreted by one analyst as mostly about time pressure in the user’s life, and by another as mostly about the software’s complexity. The analysis is influenced by the researcher’s perspective, and since narratives are rich and multifaceted, it’s sometimes challenging to decide which interpretation is “best”. Ensuring credibility might require techniques like member checking (asking participants if the researcher’s interpretation of their story is accurate) or peer review of interpretations.
-
Complex Presentation: Summarizing and reporting narrative analyses can be tricky. Unlike theme lists or counts, narrative findings might need to be conveyed through re-telling parts of the story or crafting composite narratives. It can be more text-heavy and nuanced, which might be harder for some stakeholders to digest quickly. Care is needed to highlight the key takeaways of narratives while preserving their essence.
Critical Techniques: Successful narrative analysis often entails careful transcription (including noting pauses, emotions, or tone if analyzing spoken narratives, as these can be part of the story) and possibly multiple readings of each narrative to understand different layers (first for content, second for structure, etc.).
Researchers might use coding schemes tailored to narrative elements – for example, marking segments of text that correspond to the narrative stages (orientation, event, resolution). Another technique is creating a summary narrative or synopsis for each participant that captures the storyline in a concise form; this helps in comparing across participants.
Visualization can sometimes aid narrative analysis – timelines or journey maps can be created for each narrative to outline key events and emotional highs/lows over time. This transforms the qualitative story into a more visual representation that can be analyzed or presented.
Validation in narrative analysis leans on credibility rather than statistical reliability. As mentioned, member checks are valuable: asking participants if the summary or interpretation of their story matches what they intended to convey. Also, discussing interpretations with colleagues (especially those familiar with the participants or context) can provide a check on whether the analysis is plausible. Providing thick description – richly detailing the context and narrative in the report – allows readers to judge transferability and credibility for themselves.
Example Application: Narrative analysis is particularly useful in understanding user journeys and experiences over time. For example, consider a diary study where participants log their daily experiences with a smart home device over one month. Using narrative analysis, a researcher might construct a narrative for each participant: Participant A’s story might be one of initial excitement turning into frustration as technical issues arise, then ending in abandonment of the device; Participant B’s story might be a slow start followed by growing integration of the device into daily life and eventual enthusiasm.
By analyzing these diaries as narratives, the researcher sees how events on certain days (a power outage that reset settings, a helpful customer support call, etc.) altered the trajectory of each user’s experience. This reveals when and how the device succeeded or failed to become part of users’ routines, informing improvements in user onboarding and support for the product’s future users. In another scenario, imagine a customer testimonial study: a set of in-depth interviews where loyal customers recount how they discovered a service and what impact it had on them.
Narrative analysis could extract common story elements (e.g., “initial skepticism, a turning point where the service solved a big problem, and a new outlook after adopting it”). Marketers could use these insights to shape brand storytelling that resonates with prospective customers (echoing the journey that current customers actually experience). Real-world use of narrative analysis can be seen in marketing research where analysts review customer stories on social media or forums to grasp the context of customers’ lives and challenges.
For instance, analyzing discussions among users on a health forum as narratives might highlight the journey patients go through with a health-tracking app – from first using it during a health scare, to gradually improving lifestyle, to advocating it to others once it helped them achieve goals. By preserving these stories, researchers and product managers get a human-centered picture of product impact that pure numbers cannot provide.
Framework Analysis
Framework analysis (also known as the framework method) is an organizing approach developed for applied qualitative research, especially in settings where researchers are working to inform policy or practice with a predefined focus. It offers a pragmatic balance between openness to data and using prior questions or frameworks to guide analysis.
Definition: Framework analysis is a specific qualitative technique that provides a structured, step-by-step process for analyzing data, characterized by the use of a matrix (grid) to summarize data by case (row) and theme (column). It was originally developed by researchers Jane Ritchie and Liz Spencer in the context of social policy research in the UK to help manage large qualitative studies for government agencies.
The approach is now used in various fields, including healthcare and UX, whenever a systematic and transparent analysis is needed that aligns with particular information needs.
Key Characteristics and Process: The hallmark of framework analysis is its matrix-based organization of data and its clear stages. Typically, framework analysis follows five main steps (which closely mirror general qualitative analytic steps, but with an emphasis on matrices and prior structure):
-
Familiarization: As with other methods, the researcher first thoroughly reads and re-reads all the data (interview transcripts, notes, etc.) to become deeply familiar. The aim is to list key ideas or recurrent issues that emerge from each interview or data source at a high level. At this stage, researchers often jot down preliminary impressions or potential themes, much like initial open coding but without formal coding yet.
-
Identifying a Thematic Framework: After familiarization, the researcher identifies key themes or issues that will form the framework for analysis. Some of these themes may come from the research objectives or interview topics (deductive origin), and others from what emerged during familiarization (inductive origin). The result is a set of themes and possibly sub-themes that cover the important aspects of the data. For example, in a study about user satisfaction with a software product, the framework themes might be decided as “Usability,” “Functionality,” “Support,” “Pricing,” and “Outcomes.” This set should be comprehensive enough to categorize most of the data, though it can be revised if needed.
-
Indexing (Coding): In this step, the identified framework is applied to the data – essentially a coding process. Researchers go through each transcript and index sections of text with codes that correspond to the themes and sub-themes from the framework. Typically, margin notes or annotations are used (or their equivalent in software) to tag segments of interviews with one or more theme codes. This is similar to thematic coding, but the difference is that the codes are drawn from the pre-established framework. If during indexing something significant doesn’t fit any theme, the framework can be adapted (new theme added or modified). The key is systematic application: each time a theme is mentioned or alluded to by a participant, that part of the text is marked with the respective code.
-
Charting (Matrix Creation): Once all data is coded according to the framework, the next step is charting or summarizing the data into a matrix (also called a chart). The matrix has themes (or categories) as columns and cases (individual participants) as rows. For each cell – the intersection of a case and a theme – the researcher enters a summary of that participant’s view or experience regarding that theme. Importantly, this is not just raw data but a distilled summary, though usually with references to specific quotes or observations (some approaches allow including brief illustrative quotes in cells). For example, under the theme “Usability” and the row for Participant 3, the researcher might summarize: “Found app generally easy to use, except struggled with initial account setup; appreciated tutorial (quote: ‘Tutorial was a lifesaver’).” Doing this for each participant across each theme results in a filled matrix. This matrix is a powerful visual and analytical tool – one can read down a column to see all participants’ summaries for a given theme, or across a row to see that participant’s profile across all themes.
-
Mapping and Interpretation: With the matrix (or set of matrices for sub-themes) in hand, the researcher can now analyze the data by looking for patterns, associations, and explanations across the whole dataset. This stage involves identifying typologies of cases, noting how themes relate to each other, and drawing conclusions. For instance, one might notice that participants with higher satisfaction (as seen in their “Outcomes” theme summaries) also had very few issues noted under “Usability” and “Support,” suggesting usability and support quality are linked to overall satisfaction. Essentially, the matrix allows comparative analysis: you can systematically compare across participants (to see how experiences vary) and across themes (to see the range of issues or positives mentioned for each theme).
Throughout, framework analysis emphasizes transparency. The matrix serves as a clear trail from raw data to conclusions – someone else can inspect it to trace how a particular theme summary was derived from each interview. It is also amenable to team-based analysis; multiple researchers can collaborate by splitting portions of the matrix and then reviewing each other’s summaries for consistency.
When to Use Framework Analysis: Framework analysis is well-suited for projects that have specific questions to answer or predetermined topics of interest, especially in applied settings where stakeholders require results mapped to certain categories. If a UX research study is commissioned with particular evaluation criteria in mind (say, a set of known user experience facets like efficiency, learnability, satisfaction), framework analysis provides a way to structure the analysis around those facets while still allowing new insights to surface.
It’s also ideal when working with multidisciplinary teams or multiple analysts, as the structured nature makes it easier to divide work and maintain consistency. Another prime use case is in mixed-methods research, where qualitative findings might need to align with quantitative measures: for example, if a company has a quantitative satisfaction score broken into dimensions (content, functionality, service), a framework analysis of interview feedback could align with those same dimensions, facilitating integration of qual and quant.
Originally, as an applied policy research method, it is great for any scenario where pragmatism and speed are important – the framework can expedite analysis by focusing coding on relevant areas and producing a concise output format (the matrix). In UX, this might be helpful in evaluative studies (like testing a product against a checklist of usability heuristics and user feedback). In market research, if examining something like customer opinions on several predefined aspects of a service (price, quality, convenience, etc.), framework analysis ensures all those aspects are systematically analyzed for each participant.
Strengths:
-
Structured and Systematic: Framework analysis imposes a clear structure on the data analysis process, which can be especially beneficial when dealing with large datasets. The matrix format forces a systematic consideration of each participant by each theme, reducing the chance of overlooking data. It also helps maintain focus on the research questions or criteria of interest, which is useful when one has to deliver specific insights (e.g., how did each interviewee perceive X aspect of the product).
-
Transparency and Auditability: Because of the explicit matrix and summarized data, framework analysis makes it easier for others (or the researchers themselves at a later time) to follow how conclusions were reached. Each entry in the matrix can be traced back to original data excerpts. This transparency is valuable for accountability – for example, in policy research, stakeholders can be shown that the findings are solidly grounded in participants’ responses. In a UX team context, if a product manager questions a finding, the researcher can point to the matrix and even the verbatim comments behind it.
-
Handles Team Collaboration: The method’s clarity allows multiple researchers to work together. One researcher could take half the interviews to index, another the other half, then both contribute to filling the matrix, and finally cross-check each other’s summaries. The predefined framework ensures they are categorizing information similarly. This makes it scalable for projects on a tight timeline with many interviews to analyze.
-
Balances Deductive and Inductive: Framework analysis often starts with a deductive framework (based on research aims or existing theory) but allows modification inductively. This balance means you address the topics of interest (important for applied goals) while still being open to unexpected data. It’s less free-form than pure grounded theory or exploratory thematic analysis, but more open than a purely predetermined tally. This makes it efficient yet not rigidly blind to new insights.
-
Facilitates Comparisons: Since all participants are laid out against the same thematic structure, it’s very straightforward to do comparative analysis. For example, one can easily compare if Theme A was mostly an issue for new users (rows 1–5) but not for experienced users (rows 6–10), by scanning the matrix entries. Such pattern spotting is more direct than in a general thematic analysis where one might have to mentally assemble which participants said what under a theme.
Limitations:
-
Less Emphasis on Emergent Theory: Because it often uses an initial framework, framework analysis might constrain the analysis to expected themes. There’s a risk of forcing data into the pre-set categories and missing phenomena that don’t fit. It’s important for researchers to remain flexible and update the framework if needed, but that takes vigilance. In highly exploratory projects, a framework approach might feel limiting compared to grounded theory.
-
Potential Oversimplification: Summarizing data into a matrix cell can flatten nuances. The summaries are concise by design; as a result, some richness of what was said might be lost or homogenized. Researchers must be careful to not paraphrase in a way that misrepresents or dilutes participants’ meaning. Including direct quotes in cells or linking them can help retain some of the original voice.
-
Matrix Management: For very large studies, the matrix itself can become huge and unwieldy (imagine a study with 50 participants and 20 themes – that’s a 50x20 table). Ensuring the matrix remains usable and that information in each cell is accessible (not too lengthy) is a practical challenge. It requires discipline to summarize succinctly yet informatively. Specialized software like NVivo has features to create framework matrices, and Excel or other spreadsheet tools are also commonly used. If not using software, doing this by hand or in basic word processors can be cumbersome.
-
Learning Curve: Researchers not familiar with framework analysis may need training to use it effectively. It’s somewhat less known in the U.S. UX community (more popular in the UK and in health research). If a team is new to it, they might either oversimplify the process or make it too rigid. Properly implementing the iterative aspect (adjusting the framework as needed) is key, and novices might either stick too rigidly to initial themes or conversely end up effectively doing a thematic analysis but still call it “framework.” Consistency in how cells are filled is also something that comes with practice (ensuring each summary is comparable in scope and depth).
Tools: Many teams use spreadsheets or table templates for framework analysis. NVivo’s “Framework Matrix” tool is specifically designed for this and can auto-fill cells with summarized text linked to source data. Even without specialized tools, a table in Word or Excel can suffice. The structure might be prepared in advance (themes as columns).
If transcripts are in Word, one might annotate them with numbers or labels corresponding to themes, then later transfer those points into the matrix manually. There is also potential to use collaborative tools like Airtable or Google Sheets if multiple team members are filling in data simultaneously. Visualization of results often follows the matrix analysis – for example, one could color-code cells by sentiment to see which themes were mostly positive vs negative per participant, etc.
Example Application: Framework analysis sees frequent use in evaluation studies where specific criteria are evaluated across many cases. Consider a usability study of a software system conducted across five different client organizations, where each organization is considered a case. The research questions might revolve around specific aspects: Effectiveness, Efficiency, Learnability, Satisfaction, and Barriers. Using framework analysis, the researcher sets these five aspects as the thematic framework (deduced from the usability goals).
They conduct interviews and observations in each organization. After familiarization, they might add a couple of emergent themes (say Contextual Constraints if something new came up). They index each organization’s data to these themes and then create a matrix: rows = Org A, B, C, D, E; columns = the six themes.
The matrix now allows them to compare how each organization fares on each usability aspect. Perhaps Org A and B had significant Barriers (like IT restrictions) compared to others, affecting Efficiency. This structured comparison is straightforward with the framework matrix. A real-world case in health research is using framework analysis to evaluate patients’ feedback on different domains of healthcare quality – patients from multiple clinics were interviewed, and their comments were charted by predefined quality criteria (e.g., Communication, Wait Time, Outcome, Empathy).
In UX, we can imagine a product feedback study where a company interviews different user segments (novice, intermediate, expert users) about a software and uses a framework of topics such as Onboarding, Core Features, Advanced Features, Support Needs, Overall Value. The analysis will yield a matrix that clearly shows, for instance, novices have issues in Onboarding and need more support, while experts focus on Advanced Features requests.
This can directly feed into segment-specific improvements. The strength of this method in such a scenario is providing a clear, executive-summary-friendly layout of qualitative findings aligned to the company’s focal areas. Stakeholders could literally see a table of how each user segment perceives each key aspect of the product, with cells containing the distilled essence of their feedback. In summary, framework analysis is ideal for making qualitative data actionable and digestible when working within a known “framework” of interest, ensuring that no part of the data or key topic is ignored in the analysis.
Comparing Qualitative Analysis Methods
Each qualitative analysis methodology discussed – thematic analysis, grounded theory, content analysis, narrative analysis, and framework analysis – has distinct advantages and is suited to particular types of research questions and practical constraints. Below is a comparative overview to highlight when and why a researcher might choose one over another:
-
Thematic vs. Content Analysis: These two are often compared due to their focus on identifying patterns. Thematic analysis seeks rich, nuanced themes and does not inherently quantify them, whereas content analysis often involves counting frequency of categories or words. If your aim is to deeply understand the nature of user feedback (the why and how behind it) and you have manageable data size, thematic analysis is appropriate. It’s more interpretive and allows insights that go beyond what is explicitly frequent. On the other hand, if you have a very large dataset or need results that gauge prevalence (the how many or how often), content analysis is beneficial. For example, to measure how common certain complaints are, content analysis provides hard numbers, whereas to explore the range of feelings users have about a feature, thematic analysis yields richer detail. Practically, these methods can complement each other: one might use content analysis to identify top issues by frequency, then use thematic analysis on a subset to explore those issues in depth. Neither is inherently better – it depends on whether breadth and measurability (content analysis) or depth and meaning (thematic analysis) is the priority.
-
Grounded Theory vs. Thematic Analysis: Grounded theory and thematic analysis both start inductively from data, but GT is more ambitious in aiming to generate new theory while thematic analysis is typically used to describe and interpret patterns. If a project’s goal is explanatory and one expects to develop a conceptual model (for instance, understanding the process by which users adopt a new technology), grounded theory is a strong choice. It requires more iterative data gathering and analysis commitment. Thematic analysis is less structured in requiring theoretical saturation or multiple data collection rounds – it might be used for a one-time set of interviews to summarize main themes, without the expectation of yielding a formal theory. In UX practice, thematic analysis is far more commonly applied for quick turnarounds, whereas true grounded theory studies might appear in academic or extensive discovery phases. Choose grounded theory when you have the time, data access, and need for a comprehensive theory (and perhaps when existing theories don’t suffice for your problem). Choose thematic analysis for flexible, timely insights that capture key themes but don’t necessarily build a new model of user behavior.
-
Narrative Analysis vs. Thematic Analysis: Narrative analysis differs in that it maintains stories intact. If the interest lies in individuals’ journeys or how experiences unfold, narrative analysis offers insights that thematic analysis (which might chop up those journeys into codes) could lose. For example, in a customer journey research, narrative analysis would show sequence and causation in each customer’s experience. Thematic analysis might identify common themes across customers (e.g., “frustration during onboarding” as a theme) but might not elucidate the sequence (did frustration early on lead to dropping out later?). Narrative analysis is ideal for case-based insights and human context, whereas thematic analysis is ideal for pattern-based insights across a cohort. They can be used together: one might first do narrative analyses of a few diary cases to get a sense of the story arc, then perform thematic coding across all cases to see which plot points are most prevalent. Use narrative analysis when you need to understand context, chronology, and personal meaning deeply; use thematic when you need to summarize what is common among many stories.
-
Grounded Theory vs. Content Analysis: These two are quite opposite in purpose. Grounded theory is open-ended and qualitative, seeking to build theory (quality over quantity), whereas content analysis can be purely quantitative, seeking to count and categorize (quantity often prioritized). If one attempted to quantify before understanding the phenomenon, they might miss the point entirely – hence content analysis is not suitable for discovery of new social processes, where grounded theory is. Conversely, grounded theory would be overkill if you just need to categorize feedback into known bins and measure them. In a UX setting, if you have no clear idea why users behave in a certain way and want to explore, GT is appropriate. If you have a specific set of features and want to know which features get praised or criticized how often, content analysis is straightforward. Additionally, grounded theory demands iteration until saturation; content analysis can be done on a single batch of data fairly quickly with sufficient coders. They address different questions: GT addresses "What’s really happening here and how can we explain it?", content analysis addresses "How many people said X versus Y?".
-
Framework Analysis vs. Thematic Analysis: Framework analysis can be seen as a more structured cousin of thematic analysis. In fact, the coding in framework analysis often resembles thematic coding but within a predetermined structure. The choice here depends on whether you have predetermined topics and need a structured output. If stakeholders expect answers aligned with specific categories (like satisfaction criteria, or business objectives), framework analysis is advantageous since it will yield an organized matrix of findings by those categories. Thematic analysis is better when you want categories to emerge from data freely and when you don’t mind a less tabular, more narrative final output. Framework is somewhat more top-down (yet allows bottom-up refinement), thematic can be entirely bottom-up. Also, consider team and transparency needs: if multiple researchers are working together or an audit trail is critical (as in formal evaluations), the systematic nature of framework analysis is useful. If one analyst is doing a quick exploratory study, thematic analysis’s relative informality might be fine. In sum, use framework analysis for applied, comparison-heavy projects with clear focus areas, and thematic analysis for exploratory projects where you want the themes themselves to be a key outcome.
-
Framework Analysis vs. Content Analysis: These might seem similar because both can start with predefined categories. The difference is framework analysis still deals with summarizing qualitative observations in a matrix (preserving some narrative in each cell), whereas content analysis reduces data to counts or simple categories often for statistical summary. If you need to maintain more qualitative detail per category (for example, understanding what specifically each participant said about “pricing”), framework analysis is better. It will show, per participant or case, a summary of their view on pricing. Content analysis would tell you how many participants mentioned pricing as an issue, but not necessarily detail each one’s perspective. Framework analysis is thus more informative on a case-by-case basis and useful for multi-faceted analysis (especially with small-to-medium sample sizes where you can actually look at each case). Content analysis is ideal for large samples where individual detail is less important than overall trends. Think of framework analysis as a method that maps breadth with depth (breadth via the framework categories across all cases, depth by preserving individual’s input in each cell), whereas content analysis maps breadth with quantified breadth only.
-
Narrative Analysis vs. Grounded Theory: Both of these can result in conceptual insights, but through different lenses. Grounded theory breaks data apart to build an explanatory theory that might apply across many people; narrative analysis stays within stories to interpret meaning often at the individual or small-group level. If one is interested in social processes and building mid-range theory, grounded theory is the go-to. If one is interested in how people make sense of those processes personally, narrative analysis could be more apt. For example, to study how people adopt a new habit, GT might produce a model of phases of habit adoption. Narrative analysis might reveal the personal journey of habit change for each person, highlighting unique trajectories (which could later inform personas or messaging). Narrative analysis is also more aligned with fields like psychology or anthropology focusing on lived experience, whereas grounded theory has roots in sociology aiming for theoretical abstraction. Use narrative analysis when personal meaning and story form matter, use grounded theory when generating generalizable theory from patterns matters.
It’s also worth noting that these methods are not mutually exclusive. In practice, researchers often blend techniques to suit their needs. For instance, a UX researcher might begin with a thematic analysis of interview data to identify major themes and then organize the results into a framework aligned with the product’s feature areas for presentation to stakeholders. Or they might do a content analysis of 500 survey responses to find common issues and then conduct a few in-depth interviews analyzed via narrative or thematic analysis to flesh out those issues with more context.
The key is understanding the trade-offs: thematic and narrative methods prioritize depth and meaning, content analysis prioritizes breadth and measurability, grounded theory prioritizes theory development, and framework analysis prioritizes structured, actionable organization. By matching the method to the research question and context, one can maximize the insights gained from qualitative data.
Ensuring Rigor and Quality in Qualitative Analysis
Regardless of the method chosen, certain best practices and validation techniques are crucial for credible qualitative analysis. Qualitative research does not rely on statistical tests for validity, so demonstrating the trustworthiness of the analysis requires deliberate strategies:
-
Inter-Coder Reliability (Consistency): When multiple researchers are involved in coding data (as is common in content, thematic, or framework analyses), ensuring consistency is vital. Inter-coder reliability involves measuring the agreement between different coders on how data segments are coded. High agreement increases confidence that the coding scheme is clear and the findings are not idiosyncratic to one person. Teams can improve reliability by training coders on a shared codebook, coding some data independently, and then comparing and reconciling differences. In content analysis, it’s common to report a statistic like Cohen’s kappa to quantify intercoder agreement. In thematic analysis, formal reliability stats are less common, but a similar process of comparing coding and discussing discrepancies (sometimes called code reconciliation) is used. Even in grounded theory, where one researcher might do most coding, having a second researcher review some transcripts or codes can serve as a reliability check on interpretations.
-
Triangulation: Triangulation means using multiple data sources, methods, or analysts to cross-check findings. If different approaches lead to the same conclusion, the confidence in that conclusion increases. For example, a UX team might triangulate interview findings (qualitative) with survey data (quantitative) – if both indicate users are unhappy with a certain feature, the finding is robust. Or within qualitative methods, one could triangulate by collecting data via both interviews and observation: if both sources tell a consistent story, it validates the insight. Analyst triangulation (having multiple researchers independently analyze or interpret the data) can also uncover blind spots one person might have missed. The goal of triangulation is to ensure that the insights are not simply an artifact of a single method or biased viewpoint.
-
Member Checking (Respondent Validation): This technique involves going back to the participants with either the raw findings or the researcher’s interpretations to verify accuracy. For instance, after analyzing interview data, a researcher might send a summary of the themes or a draft report segment to a few interviewees and ask, “Does this reflect your experience?” Positive confirmation from participants adds credibility, indicating the researcher’s analysis resonated with those who provided the data. If participants disagree or provide corrections, this feedback can be used to refine the analysis. Member checking is particularly useful in narrative analysis (ensuring the participant feels their story was understood correctly) and in any interpretive analysis where nuance is high. However, it should be done thoughtfully to avoid overburdening participants or in contexts where it’s appropriate (for example, it might not be feasible with anonymous survey responses).
-
Audit Trail and Documentation: A rigorous qualitative analysis should leave a clear trail of how it progressed from raw data to findings. This means saving coded transcripts, memos, draft frameworks, and notes on decisions made (such as why certain themes were merged or why a certain interpretation was favored). Should anyone need to audit the study, these materials allow them to reconstruct the analytic process. For instance, keeping a memo log in grounded theory that records the evolution of categories and the researcher’s thought process ensures that the eventual theory can be traced back to data excerpts. Even in thematic analysis, researchers might document definitions of each theme and representative quotations. This documentation not only aids transparency but also helps the researcher to systematically refine their analysis.
-
Peer Debriefing and Review: Engaging colleagues or mentors in discussion about the analysis can uncover biases or help refine interpretations. A researcher might periodically present portions of data and their analysis to a peer (who is not directly involved in the project) to challenge assumptions. For example, a market researcher could share the identified themes from focus groups with a product manager to see if they are interpreted similarly. Fresh eyes might point out alternative explanations for a finding or question an unsupported leap. This process helps in maintaining objectivity and rigor, as the researcher must defend and possibly adjust their analysis based on external critique.
-
Reflexivity: Analysts should practice reflexivity – being aware of and disclosing their own biases, background, and relationship to the data. By acknowledging predispositions, a researcher can deliberately check that those are not unjustifiably influencing the analysis. For instance, if a UX researcher personally loves a feature, they must be cautious not to downplay negative feedback about it during coding. Reflexive journaling (writing down thoughts about one’s own reactions to the data) can accompany the analysis process. Some academic-style reports include a reflexivity statement where the researcher describes their background and how they managed potential bias. In industry, this might be less formal, but a conscious mindset of “am I seeing what’s in the data, or what I expect to see?” improves trustworthiness.
-
Use of Software Tools for Rigor: While software doesn’t make analysis inherently more valid, it can aid rigor by organizing data systematically. Tools like Reveal ensure that every piece of data that has been coded can be retrieved and that all data gets at least an initial pass (since you can mark what’s coded vs not coded). They also facilitate team coding and tracking of changes. Some software can log coding actions, serving as part of the audit trail. Additionally, features like query tools (to see co-occurrence of codes, or word frequency counts) can help double-check the consistency of coding (e.g., you might query all text coded as “error” to verify that those segments indeed all discuss errors). In content analysis, text analytics software can reduce human error in counting frequencies. However, reliance on software should be balanced with manual validation.
By incorporating these practices – consistency checks, triangulation, participant feedback, clear documentation, peer input, and reflexive awareness – researchers ensure that their qualitative analysis stands up to scrutiny. The result is that stakeholders can trust the findings as a well-grounded representation of user or customer perspectives, rather than a potentially biased or anecdotal account. In summary, rigor in qualitative research comes from systematic and transparent analytical processes and from demonstrating that findings are grounded in the data (hence many of these techniques are about linking back to data or having others confirm the linkage). Whether one is performing a quick thematic analysis of a handful of interviews or an extensive grounded theory project, attention to qualitative rigor distinguishes high-quality insights that truly support decision-making.
Qualitative data from user research – the interview quotes, the stories of usage, the free-text survey answers, the diary logs – are a treasure trove of insights if analyzed with care. In this paper, we explored a range of methodologies available to make sense of such data, each bringing a different lens to understanding users’ needs, behaviors, and experiences.
- Thematic analysis offers a flexible way to distill common themes and is practically indispensable for UX teams summarizing research findings.
- Grounded theory provides depth and theoretical insight, suitable for exploratory investigations that aim to explain underlying processes.
- Content analysis bridges qualitative and quantitative realms, enabling researchers to handle large-scale feedback and measure the prevalence of issues or topics.
- Narrative analysis keeps the focus on individual user’s journeys, yielding rich contextual understanding of how experiences unfold and what they mean to people.
- Framework analysis brings order and transparency, ideal for applied settings where data must be systematically mapped onto predetermined concerns and compared across cases.
In comparing these methods, we underscored that there is no one “best” approach – the choice depends on the research questions at hand, the nature of the data, and practical considerations like time, expertise, and stakeholder needs. For instance, a product manager interested in the frequency of different complaints might lean on content analysis for a clear quantitative snapshot, whereas a UX researcher investigating a puzzling user behavior might undertake a grounded theory approach to develop a new explanatory model. Often, a combined strategy is fruitful: using content analysis to identify what to focus on, then thematic or narrative techniques to deeply understand those focal issues, and finally presenting results in a framework that aligns with stakeholders’ interests.
Crucially, we highlighted the importance of critical elements for success across all methods – from meticulous coding practices to validation techniques. No matter which analytical framework is used, the quality of insights depends on a robust process: careful reading of data, thoughtful categorization, and verification of findings. Using the right tools (software for coding, collaboration platforms, etc.) and techniques (like intercoder reliability checks and member checks) enhances credibility. By maintaining an audit trail and being systematic, researchers ensure that the analysis is not only rigorous but also reproducible and transparent.
Real-world examples illustrate how these methods come alive in practice. Whether it was identifying themes of navigation issues through a thematic analysis of user interviews, developing a theory of user churn via grounded theory on survey comments, quantifying feedback categories with content analysis in a customer service setting, interpreting diary entries as personal narratives of product adoption, or using a framework matrix to compare user feedback across multiple demographic segments – each method demonstrates its value in turning qualitative raw data into actionable knowledge.
For UX researchers, market researchers, and product managers, mastering these qualitative analysis approaches means being equipped with a versatile toolkit. In practice, one might start an analysis without a strict label and borrow techniques as needed – the end goal is to arrive at insights that are faithful to the users’ voices and useful for decision-making. An affinity diagram on a wall (thematic grouping) might segue into counting sticky notes (content analysis) or writing a persona story (narrative form) – all in service of understanding users.
Qualitative analysis is as much an art as a science. The methodologies and frameworks discussed provide structure and rigor (the “science”), while the researcher’s empathy, intuition, and creativity provide interpretation and meaning (the “art”). By applying the appropriate method or mix of methods, and adhering to systematic best practices, one can confidently navigate from the chaos of open-ended data to clear, evidence-based insights. This empowers teams to build products and services that truly reflect and meet the complex human needs revealed through qualitative research.