
At Reveal, we are always striving to enhance how you interact with and understand your qualitative research data. We’re excited to introduce a groundbreaking feature that will transform the way you visualize and interpret your research findings: Hierarchical Topic Maps. This innovative approach provides a clear, structured view of your research data, making it simpler and faster to grasp key themes and insights.
What Are Hierarchical Topic Maps
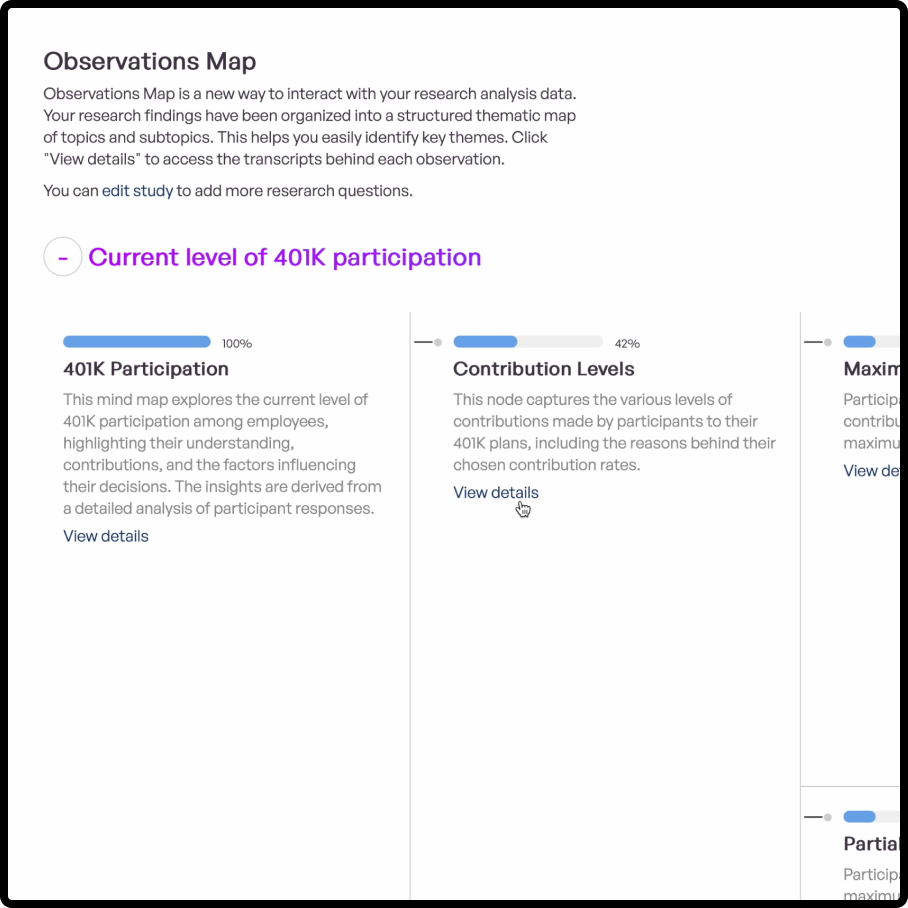
Hierarchical Topic Maps represent your research synthesis as an organized map of topics and subtopics. This new feature automatically generates a visual hierarchy based on the research questions you’ve already added to your project. It’s designed to help you quickly identify and understand the main themes and their related subtopics, streamlining your analysis process.
How It Works
- Automatic Generation: Once you’ve added your research questions, Reveal’s AI automatically generates a hierarchical map. This map visually organizes your topics and subtopics, providing a structured overview of your findings.
- Interactive Exploration: Navigate through the map to explore key themes and subtopics. Each node in the map represents a specific topic or subtopic, allowing you to easily identify and delve into areas of interest.
- View Details: Click on the "view details" link within the map to access the actual transcripts from interviews that underpin the observations. This feature ensures that you have direct access to the raw data behind your synthesized insights.
Benefits of Hierarchical Topic Maps
- Simplified Understanding: The hierarchical structure helps you quickly grasp complex data by breaking it down into manageable topics and subtopics. This visual representation makes it easier to identify key themes and relationships within your research.
- Faster Analysis: With the ability to view and interact with the map, you can streamline your analysis process and reduce the time spent searching for relevant information. The map’s intuitive design speeds up the process of drawing insights and making data-driven decisions.
- Enhanced Transparency: By providing direct access to interview transcripts, Hierarchical Topic Maps enhance transparency and ensure that your analysis is rooted in the actual data. This feature allows you to validate observations and gain a deeper understanding of the context behind your findings.
- Innovative Visualization: This new approach offers a fresh perspective on your research data, moving beyond traditional text-based summaries to provide a dynamic and interactive way to explore your insights.
Real-World Applications
Hierarchical Topic Maps can be a game-changer across various research contexts:
- Market Research: Quickly identify and understand emerging trends, customer preferences, and market dynamics by visualizing key themes and subtopics.
- Academic Research: Enhance your literature review and thesis development by mapping out key research questions and their associated findings.
- Product Development: Gain insights into user needs and feedback by exploring the hierarchical map of research topics related to your product or service.
Conclusion
Reveal’s Hierarchical Topic Maps represent a significant advancement in how you interact with your research data. By providing a clear, structured view of your key themes and allowing direct access to interview transcripts, this feature simplifies and accelerates your analysis process. Embrace this innovative approach to research visualization and transform the way you uncover and understand your insights.
Ready to experience the power of Hierarchical Topic Maps? Log in to your Reveal account today and start exploring your research data in a whole new way. If you’re new to Reveal, sign up for a demo and see how our platform can revolutionize your qualitative research process.